|
|
|
|
|
How FSPro Simulates Fires
Once the wind and weather information has been determined, FSPro can begin simulating fires. To do this, FSPro uses the Minimum Travel Time (MTT) (Finney 2002) algorithm to simulate two-dimensional fire growth. Burn probability is calculated by how many times a cell was burned, divided by the number of simulations.
The image below shows a stylized image of how FSPro works. As mentioned previously, FSPro uses one set of wind and fuel moisture conditions for each day of fire growth. The image shows four fires that burned, each under a different weather/wind scenario. The first fire must have occurred during a cold, moist, and calm period, so the fire did not spread beyond the original size (represented by the black circle). The second fire experienced calm winds, so the fire spread in all directions (blue circle). During the third fire, a south wind occurred, which pushed the fire to the north (yellow oval). The fourth fire (red oval) was influenced by a west wind.
Fire Spread Probability Given 4 Fires (Finney)
Burn probability is calculated by dividing the number of times an area (cell) burns by the total number of simulations. Therefore, in our previous example, the area that burned two times (out of four) has a 50% probability of burning, whereas the area that burned three times has a 75% burn probability.
Now let's look at some FSPro simulated fires, as well as nearby points of concern. Each fire "burned" for a seven-day period using constant wind/weather for each day of growth. The small black area is the original five acre fire that was used as the ignition. Using the artificial weather scenarios (seasons) generated (from the RAWS historic record, as well as auto-correlated from the current year's trend), each seven-day fire spread somewhat differently. As you look at each of the simulated fires, notice which points of concern were visited by fire.
In the first simulated seven-day fire, the fire spread northward, indicating that, at some point during the seven days, there was a strong southerly wind component.
Example of 7-Day Fire Burning with South Winds
This next fire must have occurred during a period of low fire danger conditions. Only the closest point of concern was affect by fire during the seven-day simulation.
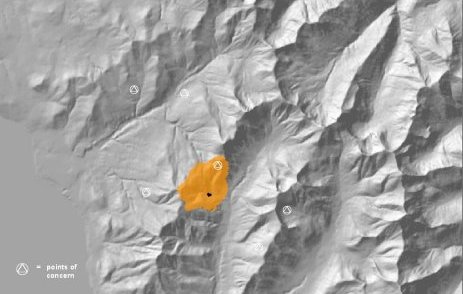
Example of 7-Day Fire Burning During Low Fire Danger
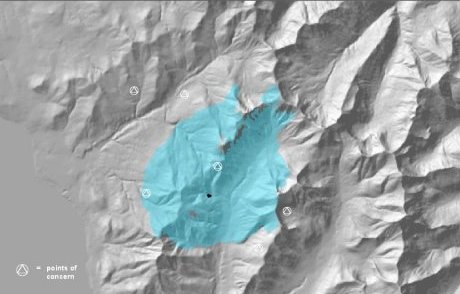
Given the circular shape of the following fire, we can assume that winds were not very strong from any one direction during the seven days of growth. Llook very closely to see a small spot fire to the north. Also notice only one point of concern was burned.
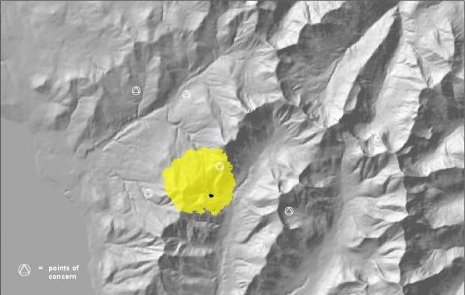
Example of 7-Day Fire Burning with Variable and/or Light Winds
The next image shows a much larger seven-day fire. This fire appears to have occurred under very hot, dry, and/or windy conditions. It likely experienced a "rare event" day. Five points of concern were affected by this fire.
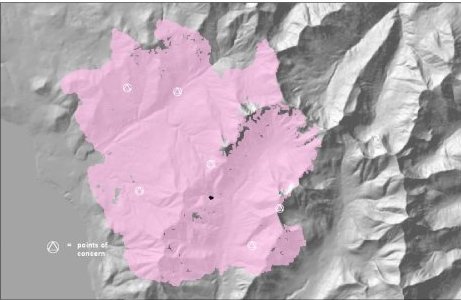
Example of 7-Day Fire Burning During "Rare Event" Conditions
Keep in mind that, with these simulated fires, we do not know if large fire growth occurred on the first of the seven days, on the seventh day, or sometime in between. At this point, we only know that this is the final fire perimeter of one of the simulated seven-day fires. In the future, fire arrival times will likely be available.
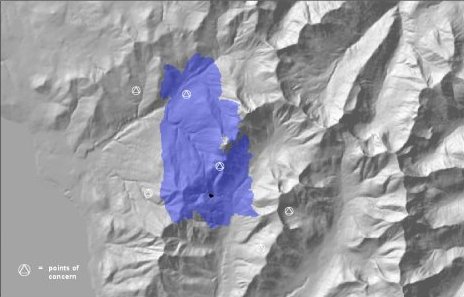
The following simulated seven-day fire probably burned under some high fire danger conditions and perhaps some south and southwest winds. Two points of concern were reached during this simulation.
Example of 7-Day Fire Burning with SSW Winds During High Fire Danger
The previous examples showed five individual fire perimeters simulated in FSPro.The following animation shows these five simulated fires, plus five additional ones, each seven days in length. As you watch the FSPro 10-fire animation animation (available online only), notice which points of concern are burned by the fires. The simulation shows how FSPro calculates fire spread probability using fire perimeters.
In This Section |
See Also |
Reference |