|
|
|
|
|
Addition outputs from FSPro
Some additional useful outputs from FSPro include the fire size table and the final fire size histogram. In the example below, look at the fire size information on the left side. This 30-day FSPro analysis (where 3008 fires were simulated) tells us that the 90th percentile fire size is 17,390 acres, meaning only 10% of the fires got bigger than 17,390 acres. It also tells us that the 10th percentile is 2806 acres, meaning that 90% of the simulated fires grew to at least 2806 acres in the 30-day simulation.
The final fire size histogram tells us that the average simulated fire size was 8829 acres. It also displays additional information. The first grey bar represents fires from 0 to 5000 acres and the 1189 represents the number of fires that were in that class. If we divide 1189 by 3008 (total number of fires simulated) we can determine that nearly 40% of the simulated 30-day fires were 5000 acres or less.
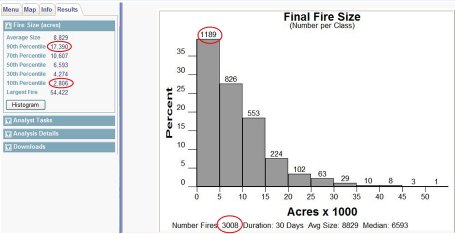
Example of an FSPro Analysis Fire Size information and Histogram
In This Section |
See Also |
Reference |