|
|
|
|
|
FSPro Results - What do they mean?
After FSPro simulates the fires and burn probability has been calculated, we no longer have fire perimeters; instead we have burn probability contours. Using our previous 10-fire example, we can see in the image below the calculated probability contours and the associated legend.
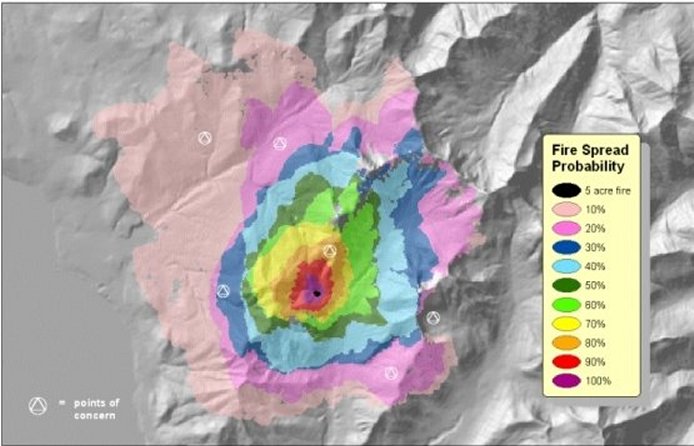
FSPro Example using 10 Fires added together to get spread probability results
Looking at the points of concern in the example, we can see that the point of concern just to the northeast of our original fire (shown as a black polygon) has an 80% chance of being affected by fire in the seven-day simulation period because it was burned 8 times out of 10. There is a 30% probability the point of concern to the west will burn within seven days. The furthest north point of concern is in the 10% probability contour because only one of the 10 fires burned that point.
Caution: It is important to remember that the different colors in an FSPro map represent burn probability contours, NOT fire perimeters or fire shapes. In addition, the burn probabilities are for the analysis time period (7, 14, days, etc.), not until a season-ending event.
When a fire behavior specialist is conducting an FSPro analysis, (s)he will select the number of fires to run (usually hundreds or thousands) that are appropriate for the situation. If the decision-makers are interested in fire spread probabilities under rare event situations, then more fires need to be simulated (500 fires or more).
Next, we'll look at an actual 30-day FSPro analysis using 3008 fires. In the example below, fire managers wanted insight into a fire's potential over the next 30 days, including rare event scenarios. Therefore, a large number of fires were simulated.
The image below shows FSPro results displayed in Google Earth. The white line is an administrative boundary, green lines show the trails and east-west Highway 14 is shown in light brown. Using the probability legend in the upper left hand corner of the image, test your understanding of FSPro to see if you can answer the questions associated with the image.

FSPro Results displayed in Google Earthä
In This Section |
See Also |
Reference |